Office Space Leasing Activity in Delhi-NCR: A Comprehensive Overview for 2021
Delhi–NCR Office Market Report 2021
Annual review of leasing, supply, vacancy, rents and occupier demand
Reporting date: January 2022
Geographic coverage: Delhi, Gurugram and Noida; Greater Noida excluded where the underlying source excludes it
Executive Summary
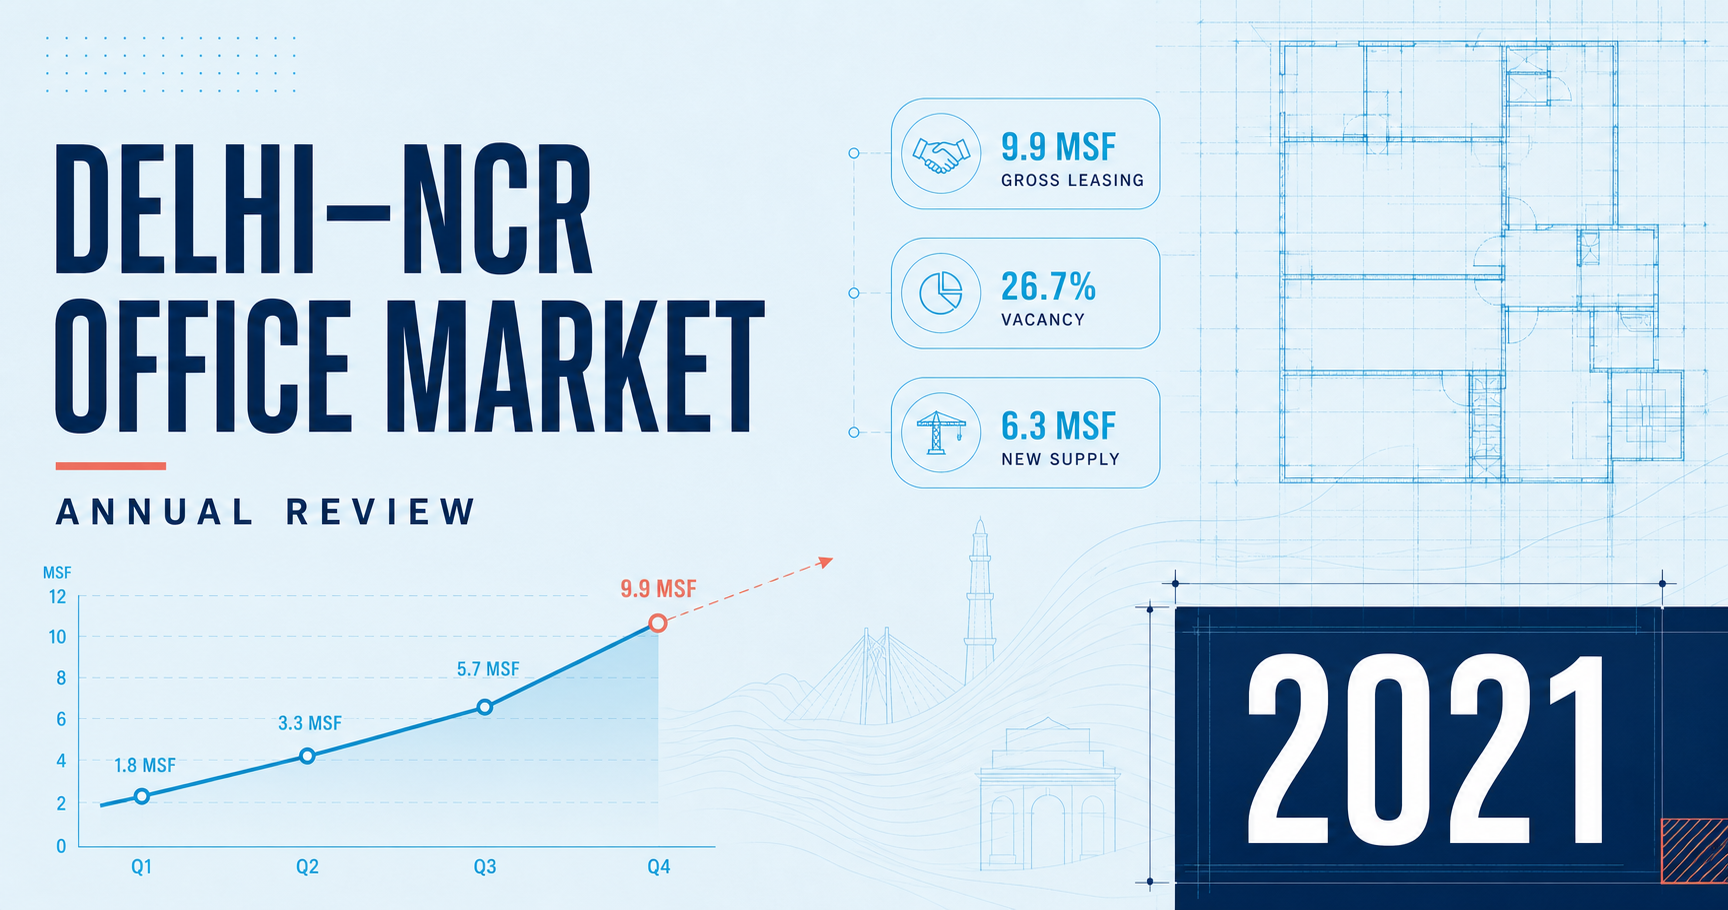
Delhi–NCR closed 2021 with a decisive improvement in office leasing during the second half of the year, despite the interruption caused by the second COVID-19 wave in April and May. Cushman & Wakefield recorded 9.89 million sq ft of gross leasing during 2021, including fresh leases, renewals and pre-commitments. This represented a 17% increase over 2020. Colliers, using a narrower Grade-A gross-absorption measure, recorded 6.3 million sq ft, 50% above its 2020 figure of 4.2 million sq ft.
The different totals are not contradictory: the two firms measure different transaction universes. C&W includes term renewals and pre-commitments; Colliers’ gross-absorption series is closer to space newly taken up. This report preserves both measures.
Gurugram remained the centre of activity. It accounted for 67% of C&W’s annual gross leasing and 64% of Colliers’ Grade-A absorption. Noida represented most of the balance, while Delhi proper remained supply-constrained and transactionally small.
The strongest change occurred in Q4. C&W recorded 3.58 million sq ft of gross leasing, the highest quarterly level since the pandemic began. Fresh leasing represented 69% of the year’s activity, renewals 17% and pre-commitments 14%. E-commerce led Q4 demand, followed by engineering and manufacturing and professional services.
Market conditions remained uneven. Core institutional corridors such as Cyber City and Golf Course Road maintained single-digit vacancy, but large volumes of strata-owned and peripheral stock kept overall NCR Grade-A vacancy at 26.7%. Weighted average asking rent ended the year at ₹62.29 per sq ft per month, below ₹64.80 at the end of 2020.
2021 headline indicators
| Indicator | 2021 result | Definition/source |
|---|---|---|
| Gross leasing | 9.89 msf | C&W; fresh leases, renewals and pre-commitments |
| Grade-A gross absorption | 6.3 msf | Colliers’ narrower transaction measure |
| Annual net absorption | 2.76 msf | C&W incremental occupied space |
| New Grade-A completions | 6.31 msf | C&W |
| Total Grade-A inventory | 125.16 msf | C&W; excludes Greater Noida |
| Overall vacancy | 26.7% | C&W |
| Weighted average asking rent | ₹62.29/sq ft/month | C&W |
| Flex share of annual leasing | 7% | C&W |
| Planned/under-construction supply, 2022–24 | 27.65 msf | C&W |
2021 IN FIVE VIEWS
Market dashboard
*Q3 derived from the reported annual total.
01 · The Year in Four Quarters
Quarterly gross leasing
| Quarter | Gross leasing | Market context |
|---|---|---|
| Q1 2021 | 2.05 msf | Activity continued from Q4 2020; professional services led demand |
| Q2 2021 | 1.77 msf | Second COVID wave interrupted fresh leasing; renewals remained important |
| Q3 2021 | Approx. 2.49 msf | Reopening and vaccination restored transaction momentum |
| Q4 2021 | 3.58 msf | Highest post-pandemic quarter; large e-commerce and corporate deals closed |
| 2021 | 9.89 msf | 17% above 2020 |
The year followed a clear interruption-and-reacceleration pattern. Q1 began with 2.05 msf of gross leasing, approximately 17% below the 2017–2019 Q1 average but resilient given remote-work policies and continuing uncertainty. The second wave reduced Q2 leasing to 1.77 msf. Transaction momentum improved in Q3 and accelerated sharply in Q4.
Quarterly net absorption and supply
| Quarter | Net absorption | New completions |
|---|---|---|
| Q1 | 0.43 msf | 2.62 msf |
| Q2 | 0.14 msf | 0.60 msf |
| Q3 | Approx. 0.80 msf | Approx. 2.96 msf |
| Q4 | 1.40 msf | 0.13 msf |
| 2021 | 2.76 msf | 6.31 msf |
The divergence between 6.31 msf of completions and 2.76 msf of net absorption explains the rise in annual vacancy. Q4 was the exception: strong absorption combined with only 0.13 msf of new supply, lowering vacancy by approximately 105 basis points from Q3.
02 · Geographic Performance
Grade-A leasing by city component
Colliers’ like-for-like series provides the clearest division between Gurugram, Noida and Delhi:
| Market | 2020 | 2021 | YoY change | 2021 share |
|---|---|---|---|---|
| Gurugram | 2.1 msf | 4.0 msf | +90% | 64% |
| Noida | 1.9 msf | 2.1 msf | +11% | 33% |
| Delhi | 0.2 msf | 0.2 msf | Flat | 3% |
| Delhi–NCR | 4.2 msf | 6.3 msf | +50% | 100% |
Gurugram
Gurugram remained the region’s principal corporate office market. Cyber City, MG Road, NH8–Prime and Golf Course Road attracted major leases and pre-commitments, while Golf Course Extension Road and other emerging corridors absorbed occupiers seeking newer buildings and more economical rents.
Cyber City alone recorded 3.2 msf of C&W gross leasing in 2021. Its year-end vacancy was only 7.3%, despite almost 14.0 msf of inventory. This reflected the continuing preference for institutional-quality assets and the arrival of new space at DLF Downtown.
Gurugram’s peripheral and emerging districts were more uneven. “Gurugram Others,” which includes Golf Course Extension Road, Udyog Vihar, Sohna Road and non-prime NH8 locations, held 42.7 msf of stock but 38.0% vacancy.
Noida
Noida recorded 2.98 msf of C&W gross leasing and approximately 2.1 msf under Colliers’ narrower measure. Noida Expressway captured a significant share of activity and new completions. The market’s appeal remained its combination of large campuses, comparatively economical rents and access to the technology and services workforce.
Noida ended 2021 with 35.17 msf of C&W Grade-A inventory, 31.6% vacancy and an asking rent of approximately ₹50.11 per sq ft per month. The large vacancy figure must be read alongside building quality: institutional projects and well-connected campuses performed better than the overall market average.
Delhi
Delhi proper remained a small part of the Grade-A leasing market. New construction was constrained, and most established stock was concentrated in the CBD, South-East Delhi and the airport district.
The Delhi International Airport submarket had the tightest Delhi vacancy at 10.8% and the highest asking rent outside the CBD at approximately ₹193.98 per sq ft per month. The CBD commanded approximately ₹282.04 per sq ft per month but recorded limited transaction volume.
03 · Vacancy, Stock and New Supply
Year-end submarket position
| Submarket | Inventory | Vacancy | 2021 gross leasing | Asking rent ₹/sq ft/month |
|---|---|---|---|---|
| Delhi CBD | 1.48 msf | 25.8% | 0.05 msf | 282.04 |
| South-East Delhi | 6.83 msf | 20.2% | 0.11 msf | 104.93 |
| Delhi International Airport | 1.37 msf | 10.8% | 0.65 msf | 193.98 |
| Cyber City | 13.99 msf | 7.3% | 3.20 msf | 117.67 |
| MG Road | 3.33 msf | 16.8% | 0.00 msf* | 115.05 |
| NH8–Prime | 14.54 msf | 13.9% | 1.50 msf | 80.89 |
| Golf Course Road | 5.76 msf | 9.5% | 0.21 msf | 89.74 |
| Gurugram Others | 42.70 msf | 38.0% | 12.55 msf | 53.55 |
| Noida | 35.17 msf | 31.6% | 9.38 msf | 50.11 |
*C&W’s year-end table shows no annual gross-leasing activity under MG Road while separately recording transactions there; this reflects classification/timing treatment and should not be interpreted as literal absence of leasing.
New supply was concentrated in Noida and emerging Gurugram corridors. Of the 6.31 msf completed during 2021, Noida contributed approximately 4.07 msf. Cyber City added 1.29 msf and NH8–Prime added approximately 0.65 msf.
The planned and under-construction pipeline stood at 27.65 msf for 2022–2024. More than three-fourths was expected in Noida Expressway, Golf Course Extension Road and Cyber City. That pipeline created a balanced outlook: substantial modern stock would become available, but overall vacancy could increase if absorption did not keep pace.
04 · Rental Trends
NCR’s weighted average Grade-A asking rent declined from ₹64.80 per sq ft per month at end-2020 to ₹62.29 at end-2021. The fall reflected the addition of lower-rent peripheral supply and vacancy in strata-owned projects rather than a uniform decline across prime buildings.
Core-market landlords were beginning to reduce concessions by year-end. Q4 leasing strength and tight vacancy in Cyber City and Golf Course Road supported greater confidence on rent-free periods, common-area-maintenance waivers and other commercial terms.
Rental hierarchy at year-end 2021
- Delhi CBD — ₹282.04
- Delhi International Airport — ₹193.98
- Cyber City — ₹117.67
- MG Road — ₹115.05
- South-East Delhi — ₹104.93
- Golf Course Road — ₹89.74
- NH8–Prime — ₹80.89
- Gurugram Others — ₹53.55
- Noida — ₹50.11
These are stock-weighted asking rents for vacant Grade-A space, not achieved rents for every transaction.
05 · Occupier and Sector Trends
Demand composition changed materially during the year.
Q1
Professional services represented 31% of leasing, captives 13%, and healthcare and pharmaceuticals 12%. The quarter also recorded downsizing and exits as occupiers continued portfolio reviews.
Q2
The second wave reinforced cost optimisation and renewals. Engineering and manufacturing was the largest pan-India occupier group, while Delhi–NCR registered a comparatively high renewal share. Pre-leasing remained active despite short-term uncertainty.
Q4
E-commerce represented 24% of NCR leasing, supported by large requirements. Engineering and manufacturing contributed 16%, and professional services 11%. Fresh leasing increased, suggesting that occupiers were moving beyond short extensions and beginning to execute expansion or relocation decisions.
Flexible workspaces
Flexible-workspace operators represented approximately 7% of annual and Q4 leasing. Enterprise seat take-up increased sharply during Q4. Larger operators were benefiting from demand for managed offices, lower upfront capital expenditure and the ability to accommodate uncertain headcount plans.
The market remained difficult for smaller coworking operators. Several reduced or closed centres during the first half, while larger operators and landlords explored managed-office formats aligned with enterprise demand.
Startups
Colliers estimated that startups took approximately 1.0 msf in Delhi–NCR during 2021, the highest startup space take-up among India’s larger office markets. This supported demand in Gurugram and Noida, although the durability of startup hiring and funding remained an important risk.
06 · Largest Identifiable Office Transactions
The table below contains transactions identifiable from contemporaneous market reports and deal announcements reviewed by the January 2022 cutoff. It is not presented as a complete Top 100: public disclosure did not support an independently verifiable 100-deal ranking. Where reputable sources reported different approximate areas, the table preserves the range rather than selecting one estimate without access to the registered lease.
| Rank | Tenant | Property | Submarket | Area | Transaction type | Reported period |
|---|---|---|---|---|---|---|
| 1 | Amazon | DLF Downtown | Cyber City | 500,000 sq ft | Pre-commitment | Q4 |
| 2 | Netmagic | Artha SEZ | Noida | Approx. 400,000 sq ft | Lease | 2021 |
| 3 | Samsung R&D | Candor TechSpace, Sector 135 | Noida | Approx. 357,000–400,000 sq ft | Lease | Q3 / 2021 |
| 4 | Zomato | Capital Tower 2 / Downtown Capital Tower | MG Road, Gurugram | Approx. 300,000–375,000 sq ft | Relocation | Q4 |
| 5 | Encore Midland Credit Management | Candor TechSpace, Tikri | Gurugram Others | Approx. 221,000–250,000 sq ft | Relocation | Q4 / 2021 |
| 6 | Legato | Candor TechSpace, Sector 21 | Gurugram | Approx. 210,000 sq ft | Lease | 2021 |
| 7 | Syneos Health | DLF Downtown | Cyber City | Approx. 210,000 sq ft | Pre-commitment | Q1 |
| 8 | EY | Advant Navis Business Park | Noida | Approx. 180,000 sq ft | Expansion | Q1 |
| 9 | Microsoft | KP Tower | Noida | Nearly 150,000 sq ft | Lease | Q1 |
| 10 | Webhelp | DLF Centre Court | Golf Course Road | Approx. 114,000 sq ft | Expansion | Q1 |
| 11 | Cyril Amarchand Mangaldas | Max Towers / Delhi One | Noida | Approx. 79,933–88,853 sq ft | Relocation | Q1 |
| 12 | Axtria | Candor TechSpace | Noida | Approx. 78,600 sq ft | Expansion | Q4 |
The concentration of large transactions in Cyber City, MG Road and institutional Noida campuses reinforces the flight-to-quality theme visible throughout 2021.
Together, these 12 disclosed transactions represent approximately 2.9–3.1 msf. They should not be summed against a single brokerage total without qualification: the list mixes fresh leases, relocations and pre-commitments, and the brokerage totals use different inclusion rules. It nevertheless provides a credible view of the year’s largest publicly identifiable commitments.
07 · Capital Markets and Landlord Strategy
Occupiers retained negotiating leverage across high-vacancy districts, but the balance varied by asset. Institutional buildings with strong maintenance, hygiene systems and access performed better than strata-owned or peripheral stock.
Landlords increasingly prioritised:
- pre-commitments for projects under construction;
- flexible deal structures tied to longer lock-ins;
- fitted or managed solutions that reduced occupier capital expenditure;
- completion of buildings with committed tenants before speculative phases;
- health, air-quality, access-control and building-management standards.
Investor interest remained concentrated in stabilised Grade-A assets with strong tenants. The gap between prime institutional buildings and fragmented stock was becoming more visible in vacancy, leasing velocity and commercial terms.
08 · Outlook for 2022
As of January 2022, the principal uncertainty was the Omicron wave and its effect on workplace reopening. The rise in infections could temporarily delay employee return, but large leasing decisions were expected to remain supported by corporate expansion, outsourcing and the need for modern space.
The 2022 outlook rested on five factors:
- Return-to-office timing. Faster vaccination and a milder health impact would support workplace reopening during 2022.
- Large supply pipeline. Noida Expressway, Golf Course Extension Road and Cyber City were expected to receive most new completions.
- IT-BPM and professional services demand. These sectors were expected to remain important leasing drivers.
- Flex and managed offices. Enterprise use of managed space was expected to increase as companies sought flexibility and lower capex.
- Two-speed vacancy. Prime projects could remain tight even if the overall NCR vacancy rate increased with new supply.
The most probable market outcome was higher transaction activity accompanied by continued pressure on secondary and fragmented stock. Prime, well-managed buildings were better positioned to capture relocations and expansion.
Methodology and Source Reconciliation
This report uses information available by 31 January 2022. Its primary statistical framework is Cushman & Wakefield’s Delhi–NCR Office MarketBeat Q1 and Q4 2021 and India Office Market Report Q2 2021. Colliers’ January 2022 Delhi–NCR review provides the city-level Grade-A absorption comparison. JLL’s year-end commentary provides additional net-absorption and completion context.
Definitions differ:
- C&W gross leasing includes fresh leases, renewals and pre-commitments.
- Colliers gross absorption uses a narrower Grade-A transaction universe.
- Net absorption measures incremental occupied stock and can be lower than leasing when renewals, future pre-commitments, exits and downsizing are considered.
- Vacancy and inventory vary by building-grade classification and geographic coverage.
The report therefore presents source-specific totals rather than averaging incompatible figures.